


1 Trillion Club
Data Visualization
3.9
/5
Toolio reviewer
Suits serious entrepreneurs but lacks in-depth data analysis features.
HONEST REVIEWS. REAL EXPERIENCE.
Find the tool, and find out what it is bad at
Every tool is opened and used by a Toolio reviewer, who scores it and writes the honest pros, cons and a clear verdict. No hype, no fluff.
Tick Compare on any two to four cards to put them side by side.
Suits serious entrepreneurs but lacks in-depth data analysis features.
Not for small teams.
If you're starting, this is for you. If looking to dive into complex analytics, skip it.
Automate complex document operations with Affinda, suited for any industry but may not be ideal for simple forms.
Afterquote helps you accelerate your business with AI-powered quote creation but requires a one-time fee for setup.
Suits light to medium Google Workspace users, not heavy AI model users.
AI-Mask is a web extension for local AI model execution. It runs models on-device, but lacks a free tier.
AI document parser that extracts structured data from emails and PDFs without code.
Secure AI data workflows in TEE environments.
Easily analyze and evaluate data.
Limited to USA players, free offers only.
arivis Cloud offers AI training for image processing but lacks a dedicated free tier.
Expert human data for training advanced AI models.
Describe app in plain English, AI generates native Android + iOS.
Identify meaningful metric shifts early, before they show up in reviews.
AI apps and tutorials, powered by AI.
Unified inbox and server management in one platform.
Runs many ChatGPT prompts at once and exports the results as CSV or JSON for analysis.
Explore a wide variety of components and services. Easy to browse.
BigML simplifies machine learning, offering a comprehensive platform for building models. It falls short on extensive customization.
Import lab tests into one app easily.
Suitable for contact centers, not suitable for solo operators.
A no-code referral program builder with templates, unique links and QR codes for every referrer.
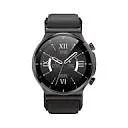
BP Doctor MED is a smartwatch that monitors blood pressure and other health metrics.
Build websites and manage data.
Cosine trains AI models to write production-quality code.
Streamlines client instructions for faster transactions and stronger control.
Searches census database with natural language queries.
Get real-time data insights without manual intervention.
Secure your domain before it's too late. ChartEye Browser Extension.
ChartGPT struggles with complex data visualization tasks.
Builds interactive charts with instant customization, plus AI suggestions on the best chart type to use.
Adds filters and visual charts to Google, Bing and Baidu results, tuned to what you actually meant.
Checks the credibility of online claims by rating the sources behind them.
Identifies inaccurate web traffic and helps secure data. But can be slow to implement.
Cloud Hero streamlines digital modernization and automation.
Transformative Insights with AI-Powered Surveys and Participant Recruitment
Transform complex code into clear flowcharts instantly.
A well-established .email domain with a strong backlink profile, yet its length makes it less ideal for very long content.
Not ideal for large datasets, lacks advanced analytics.
Connected Papers helps find related papers visually, but lacks a free tier.
Improves Tet, warns of phishing sites.
AI fills and validates PDF forms, saving time.
Hosts courses, communities and coaching, with H5P and SCORM interactive content built in.
Generate protein candidates and track rounds easily, speeding up development.
It captures trapped workflows and shares them across your org.
Daetama enhances Tet by spotting hard-to-track data resources and quick updates. Uzmanību!
Collects data from the websites you browse to feed Dataflick's personal AI knowledge assistant.
Three worth starting with
Data visualization tools turn spreadsheets and query results into charts, tables and dashboards, and AI versions such as Julius AI let you ask for a chart in plain language. They suit analysts, marketers and students who have data but little design time. Check whether a tool lets you inspect or edit the underlying calculation, since an attractive chart can still be wrong.
Yes, many tools read an uploaded file or connected sheet and propose chart types from the column names and values. The suggestion may still be misleading, for example a pie chart for too many categories, so review the axes, totals and labels before sharing.
Visualization is about presenting data clearly as charts. Business intelligence adds the pipeline behind them: connecting sources, cleaning, modelling and scheduled reporting. A one-off chart for a presentation needs visualization only; a weekly company dashboard usually needs BI.
Treat uploads as shared with the vendor unless the terms say otherwise. Look for statements on retention and model training, remove personal identifiers first, and use a sample file while testing. Sensitive financial or health data deserves a tool with clear data-handling commitments.